Showing posts with label PYP Exhibition. Show all posts

Tuesday, 26 April 2016

Graphs as an Inquiry Provocation

We are kicking off our Exhibition this week and thought to help the children tune into their chosen central ideas, we could use graphs.

This idea though, I think would be useful as a tuning in learning experience for any Unit of Inquiry.

I really like Kath Murdoch 's explanation that the tuning in part of the inquiry cycle is often misconceived as simply tuning kids into the topic. Rather she explains how the tuning in time should be seen as an opportunity for teachers to tune into what the children are wondering and previously know. (She says this much better in her own words.  See Kath's blog post here )

We began by looking at our central idea we would be using for this:


The children found two interesting graphs on Google images related to the central idea.

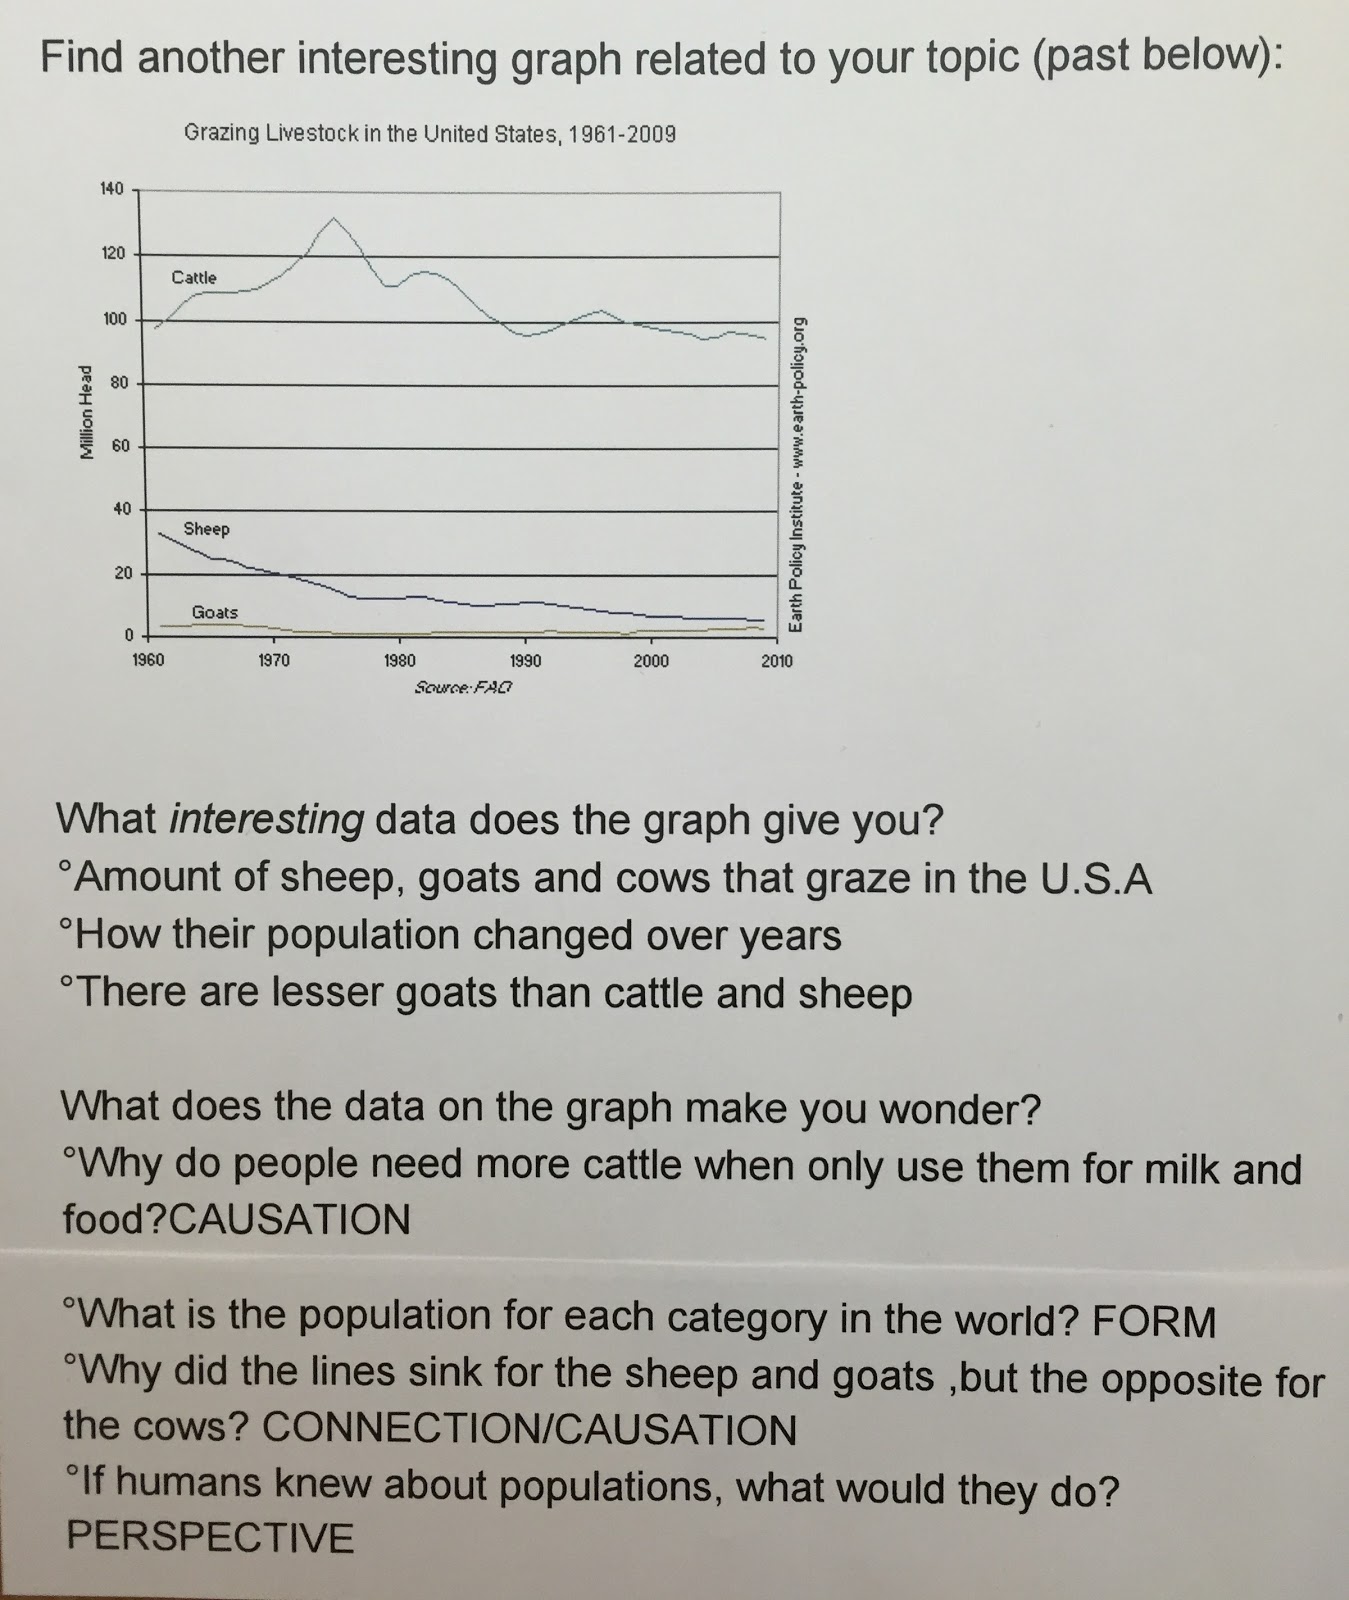
Examining each graph, they recorded interesting data the graph provided about their topic and then wonderings they gained from reading the graph.

It worked really well.  

It helped broaden what they could be enquiring into and served as a student-driven provocation. 

When we later looked at creating our lines of inquiry, many children used this provocation to form what they wanted to learn.  It aroused a lot of curiosity and deep thinking.


Afterwards, we shared our graphs with peers explaining what the graph told us and what it made us wonder.  Students not selecting that inquiry topic equally became interested in the graphs and suggested other wonderings they harboured from reading it. This generated a lot of interesting discussions about what they might want to discover.   


We then write reflections on post its about what we learnt, discovered or realised about the central idea and we shared and discussed these as a whole class:


= Using graphs as a tool to create your own theories? - love it!


Changing perspective on graphs, well slowly


= what a deep thought!
 
     Changing perspective on graphs
Love this- help you to visualise and understand things more easily


Samples:


This student wants to enquire into connections between the ice age and global warming and the effects of both on wildlife.

In sharing the graphs, she wondered: Does this mean the ice age ended because of global warming?

This is the type of provoking wonderings graphs can help children to formulate.


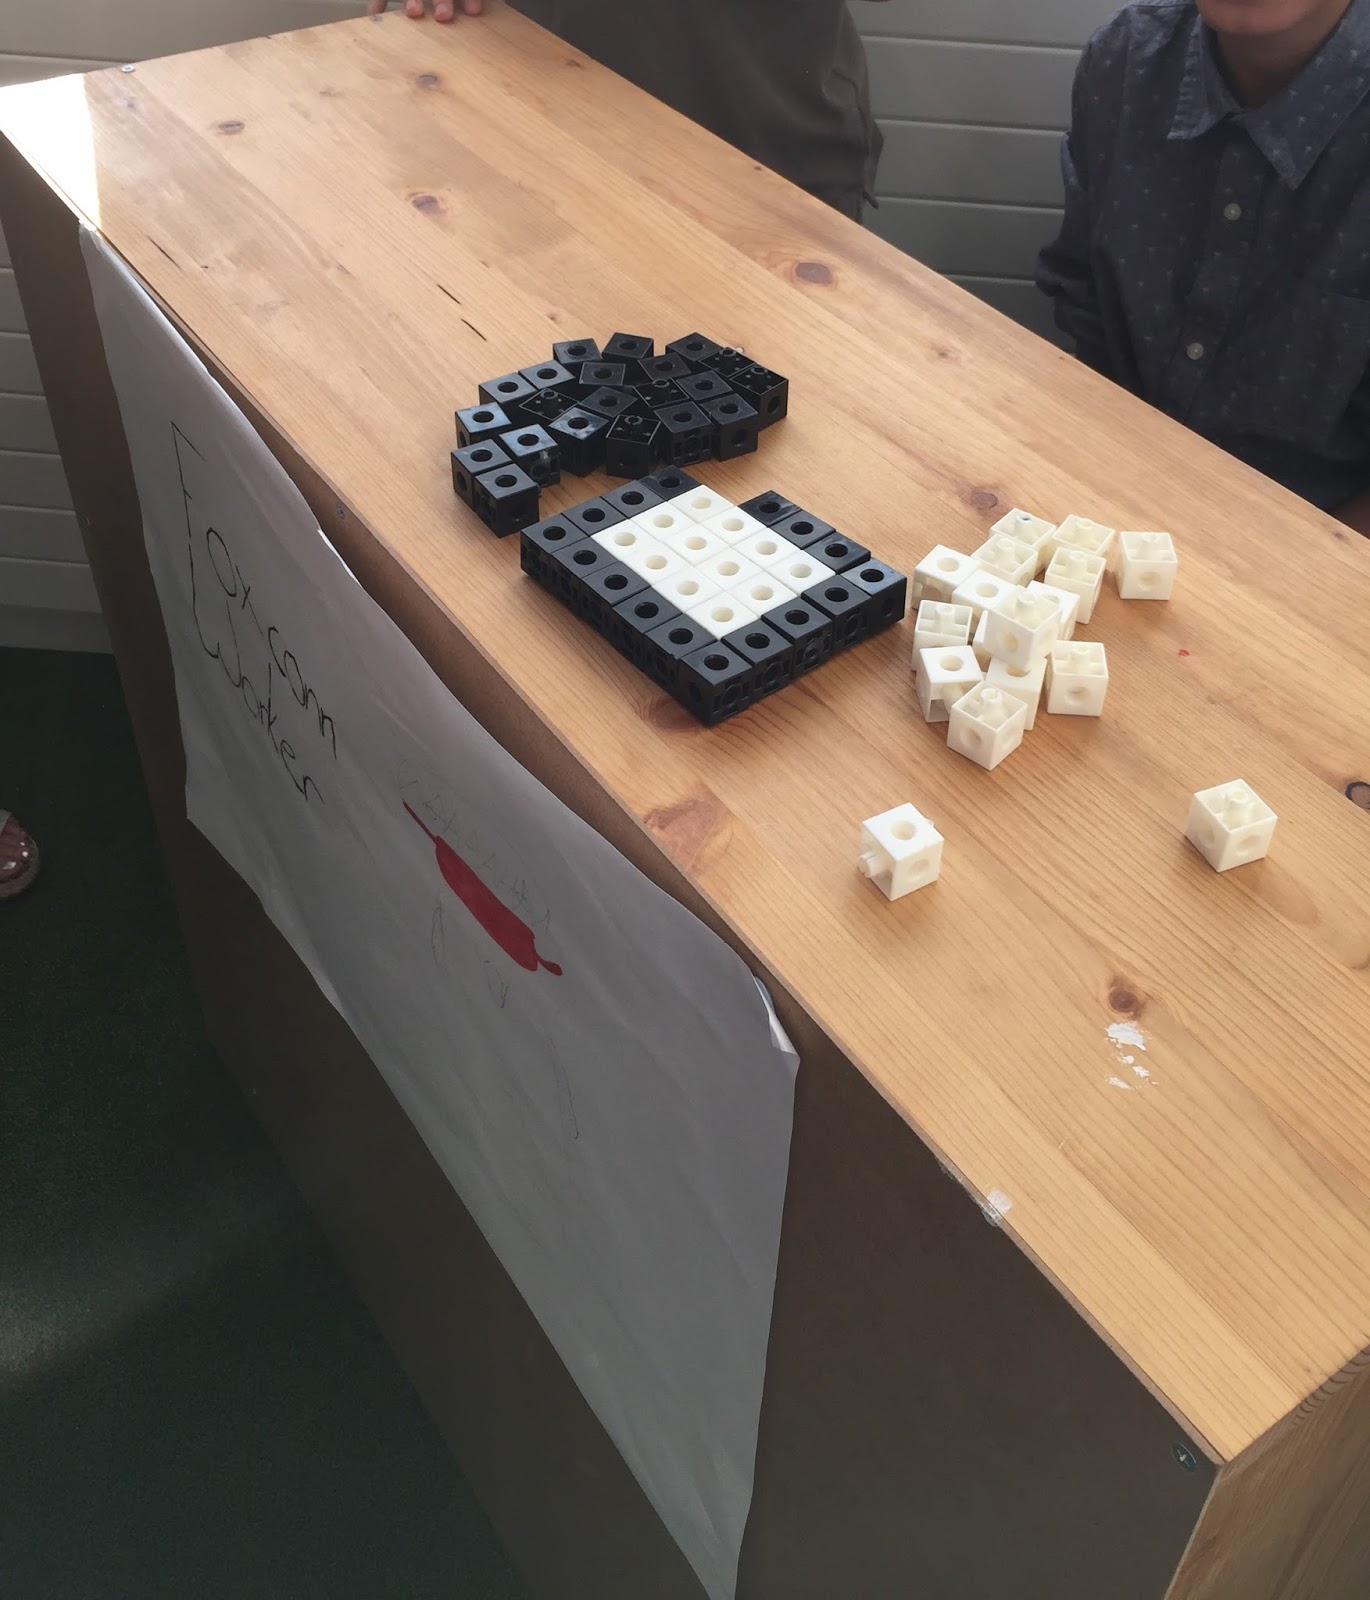
This student wants to enquire into the effects of colours used in advertising.
At first he wasn't sure if it was a graph or a diagram.

It made a few of us wondering:


This student wants to learn about what goes into pet food and why. She also found a really creative graph:


Even a student enquiring into how the lives of people living in the Stone Age affect our lives today can use a graph to learn and wonder:


This student is wanting to enquire into the effects on animals living in factory farms v free range farms:


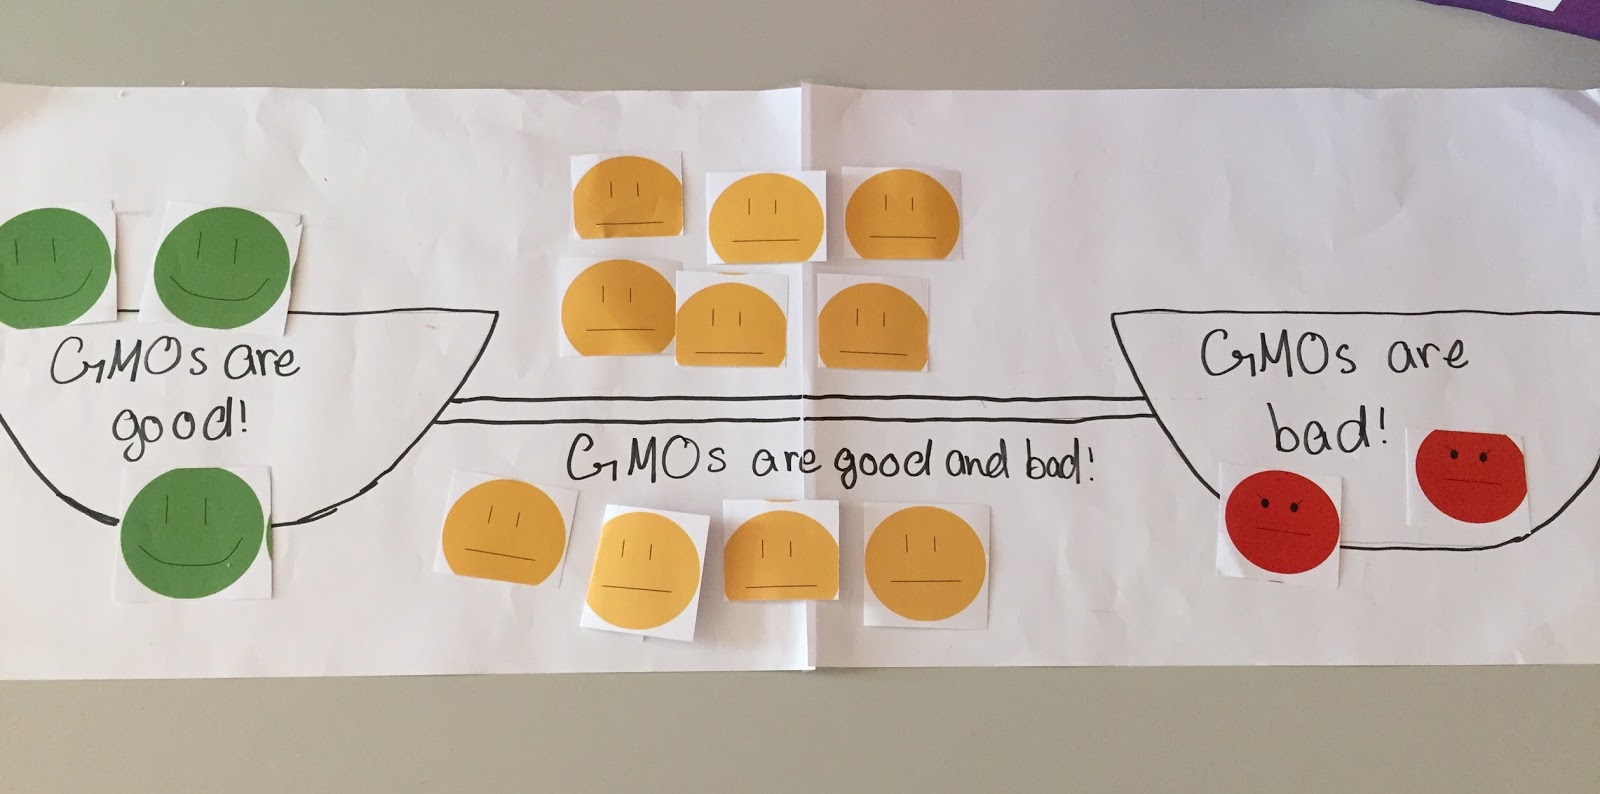
To help them think about which key concepts they might want to use the most for their Exhibition lines of inquiry, the last step was to see if they could match a PYP key concept to each wondering they had:


I really need to learn this as a provocation tool more often in Units of Inquiry!!!!

Hearing and reading their reflections showed rich learning and a deepened appreciation for the usefulness of graphs.


Reflecting throughout this learning, I kept thinking about Kath Murdoch's perspective on tuning in.  Indeed, by listening intently to what each child was thinking and the wonderings that unfolded in their minds, I could find myself tuning into each of them as learners and where they may want to direct their own learning journeys.


Making this discovery today as an effective tuning in and enquiry strategy that is student-owned really makes me wish I could start my teaching career all over again and use it with previous classes I've had!


Saturday, 6 June 2015

Maths in the PYP Exhibition

PYP Exhibition Umbrella Central Idea:


For our PYP Exhibition under the transdisciplinary theme: Sharing the Planet , we used this umbrella central idea to enquire into consumerism and ethical choices we can make in our daily lives as consumers.


    As consumers, we can make impacts in our world.


This umbrella central idea served as an easy way for the children to create their own central ideas after selecting a consumer topic they were passionate about.

Examples:

° By choosing to buy free-range eggs, we can make impacts on the lives of hens.

° By buying MSC sustainable fishing products, we can make impacts on ocean ecosystems.

° By boycotting brands that use sweatshop labour, we can make impacts on the lives of millions of workers in the world.

° By choosing to be vegetarian once a week, we can make impacts on animals and our environment.

° By deciding to only eat Fairtrade chocolate, we can make impacts on people's lives and our environment.

etc


This Youtube: The Story of Stuff  was one of the provocations we used as a lead in to the concept of consumerism.  It generated wide-eyes and loads of questions.


Why such a great umbrella central idea for an Exhibition?

° helped children foster a real sense that they are global citizens; the consumer choices we make here in Switzerland everyday can impact people, animals or the environment globally positively or negatively

° all levels of personal interests can be met (science, animals, human rights, sport etc)

° easy for children to use primary sources by interviewing companies, consumers on the streets, surveying consumer habits, Skyping organisations related to their topics.

° children could easily connect (they are part of the consumer system)

° easily sparked genuine passion that stayed strong throughout the whole Exhibition (and beyond!)

° easy to take real action (living in a state of 'Utopia' like Switzerland, it's tricky to think of a broad enough concept the children could take real action with- consumerism definitely fits )

° they were taking additional action in their own families too as they questioned their own consumer habits and why their families should be making more ethical choices

° lifelong action (not just action during the Exhibition); the seed has been planted that they can take positive action throughout their lives by the consumer choices they make

° they all felt they could genuinely do something to make our world a better place 


Some of the consumer topics children enquired into:


° the pros and cons of GMOs                 ° animal tested cosmetics

° the meat industry                              ° e-waste

° blood diamonds                                 ° zoos

° child labour products                          ° print v e-books

° buying locally produced food               ° the fast food industry

° sweatshop products                           

° FIFA v UEFA (Should we boycott Qatar World Cup sponsors? / Is the UEFA more ethical than FIFA?)

° eco-tourism                                      ° free-range eggs v caged eggs

° sustainable fishing                             ° green energy

° using public transport                        ° dolphin-friendly tuna

° Fairtrade products (chocolate, coffee, bananas etc)

° alternative medicine

° how Apple produces its products in third party factories such as Foxconn
    (Is there a more ethical mobile company to buy from?)

° sponsorship money in sports and sports products


Maths in our Exhibition:

Being inspired by Bruce Ferrington's amazing maths blog ( Authentic Inquiry Maths ), we thought we should also give mathematical thinking a greater focus in our Exhibition this year and beyond the typical pie graphs of survey results.


Our other persuasion when it came to sharing our findings were:

° Do not create a poster board with paragraphs stuck all over it.  NO ONE (except maybe your parents) will read any of it.  It is not an effective way to communicate.

° Maximum number of statements / questions displayed is 10, so make them provocative!  Make people think when they read a statement you are displaying.

° No 'death by powerpoints' - so unengaging

° Make your display as interactive as possible: have visitors do something to learn about your consumer topic

° Create art to provoke thoughts

° Talk WITH people, not at them. No rehearsed boring scripts.

° Each time someone approaches your display, begin by asking them a provocative question to engage them. Eg, Did you know that Switzerland is the second worst country in the world for e-waste?   /   Do you know how the clothes you are wearing were made?   We use these techniques in writing and so we should try them orally too.  Grab their attention by asking them a provocative question or statement.  Then, they will be really interested in what you want to share with them. 


Some children used maths in some really creative ways:


This student enquired into the pros & cons of print and e-books. 

He worked out how much paper has been used to publish in print the Harry Potter series globally.

Being a maths genius that he is, he calculated that approximately 
1 080 000 trees were cut down to create the paper to print all the Harry Potter books globally since they were first published till today.


His graph's key shows 1 tree is representing 10 000 trees cut down.  


To provoke people to think about this, he equated all those trees to 1 kindle.


Which is an ethically better consumer choice?  Print or e-books?


This group enquired into sweatshops.

They calculated how many hours a sweatshop worker in different developing countries would have to work to be able to buy a school lunch.


Makes you think..........


Interactive timeline.....

People visiting this display about e-waste, needed to place the electronic products on the timeline in order that they thought the e-products were invented.  


This group created a really interesting probability device to help viewers understand issues related to child labour around the world.

Participants were asked to think what is the probability /likelihood of each answer being correct.....  How would you rank the probability of each answer?

You placed a marble in the question tube and the marble would pop out where the correct answer was!   So engaging!!!


What the device looked like behind.


The tubes sticking out weren't the correct answers so didn't need to reattach to the display board.


Amazing idea!!!


After finding out what they had learnt about GMOs, participants were asked to place a face on this interactive graph:


This group used time.

They had enquired into the working conditions at the Foxconn factory in China which makes iPhones.


Participants needed to make an 'iPhone' using the cubes in under 1 minute to gain a sense of the pressure the workers might be under. 

To make the mobile, they explained you needed to make a 3 by 4 rectangle using white cubes and then surround those with black cubes so it becomes a 5 by 6 shape.


Participants needed to estimate first whether they thought they could do it under 1 minute or not.


These children enquired into why some sports players get paid so much by companies like Nike.


Yet, the companies 'cannot' afford to pay the people who make their products a better salary?!?


They get paid more than Prime Ministers, climate scientists and doctors combined! Why?!?!?


E-waste Interactive Live Graph:

Participants placed the type of mobile they have on the graph.

Why are iPhones so popular?


Should we be upgrading our mobiles as often as we do?   


What happens to mobiles after we discard them?


This group found out that Switzerland is the second worst country in the world when it comes to e-waste.  


Why is that when Switzerland leads the world environmentally in so many other areas people wondered........


What should we be doing?


Why do I get persuaded to upgrade each time a new iPhone is released?


Ironically, I take a photo of this interactive graph with my new iPhone 6 and think:   How have I allowed myself to become a marketing victim so easily?!?!?


Assessment rubric section we used for the maths part of our Exhibition:


Use of mathematical thinking
No evidence of mathematical thinking shared
Little evidence of mathematical thinking shared
Some good use of mathematical thinking shared
Effective use of mathematical thinking shared
Creative and effectively communicated use of mathematical thinking shared