Showing posts with label Data Handling. Show all posts

Thursday, 22 October 2015

Data Handling Maths Planner


Creating a PYP Maths Planner:

Experimenting with different ways to create and implement PYP maths planners over the years, I've found the following the key elements in helping a maths unit become enquiry-based, student-owned, flexible for differentiating student needs and to allow each child to feel successful as a mathematician:

° The central idea is pivotal. The language needs to be simple enough for each child to understand it and it should allow for a wide range of student-generated questions that they or we as a whole class could enquire into. The central idea should be useable for students to record the reflections on what they have learnt during the unit. 

° Beginning in the first few sessions by introducing the central idea and asking students to generate questions we should find out about to become experts on the meaning of the central idea arouses student curiosity and instantly lankes the unit student-owned as they decide what they need/want to learn.

° Lines of inquiry must link up with a PYP key concept to guide and deepen the conceptual understandings. Using the key concepts instantly makes the maths unit enquiry-based rather than a traditional skills-oriented unit of learning.

° Give the central idea on a large A3 paper as a summative assessment. During the unit, students are given 5 to 10 minutes every few sessions to record what they have discovered. This reflection time allows the students to deepen their understanding of the central idea which is the essence and whole purpose of the unit.    

Example Summative for Place Value /Number Systems Unit

Example Summative Using Central Idea for Measuring Time Unit


PYP Planner for Data Handling Unit 
(Google Doc link below):


Transdisciplinary Theme:  

How we organise ourselves


Central Idea: 


We can investigate data more easily with suitable graphs.

Student-generated questions when unpacking our central idea:


Unit of Inquiry Link (Migration: Where we are in place & time):


°  Function:  analysing data to determine migration patterns


Lines of Inquiry:

° FUNCTION: Ways we can analyse data
  • Create memory hooks to help remember what the mode, median, mean and range are. Display memory hooks on wall for reference.
  • Students grouped into 5. Time how fast they can sprint across football pitch forwards and backwards.  Gather data and analyse- mean, mode, mean, median
  • Bowling scores - mean Students imagine they have been bowling with 5 different scores. Then use these to calculate their average score.( what is an average?  How do we know if we have calculated the average correctly?) Next, calculate the average scores of group partners and then the entire group's average. Bowling Scores Mean Home learning (Based on student-generated scores in class for next week)
  • Reading graphs (pie graphs, line graphs) google docs
  • Students toss pillows and record distances. Then decide ways the collected data can be analysed and suitable graphs.
  • Students collect own data from class and then select ways to analyse the data and select suitable graphs to convey it. Eg, languages spoken, number of countries travelled to, number of places migrated to (UOI link) etc


° FUNCTION: How to create line and pie graphs
  • Pie graphs: students given circles to determine simple amounts of pie graph % (peer teaching)
  • Pie graphs: number of languages we speak, number of countries we have travelled to etc.  Collect data languages migration countries etc Students determine which graph most suitable to convey data and explain why
  • Line graphs: choose type of temperature / precipitation graph of Lausanne to create Creating line graphs: differentiated between 3 types
  • Students select a city in:  the Northern Hemisphere and the Southern Hemisphere and record daily max and min temperatures as a line graph on back wall for a fortnight. Calculate daily range in temperatures.At end of fortnight, calculate different ways to analyse the data: mode, median, mean, general statements etc.  Discuss reasons for difference in temperatures between the two hemispheres.


° REFLECTION: How to determine suitable graphs to convey data
  • activity google doc: which graph is suitable and unsuitable. Think-pair-share
  • Student time sprinting and student created data collecting activities: determine a suitable graph and explain why you felt it was the best choice


° CONNECTION: How we use graphs in our daily lives
  • Use graphs for migration group enquiries requirement; analyse the data in the graphs
  • Students find graphs in local newspapers etc during the unit to discuss in groups of why they were used


°  FUNCTION (Migration Unit Link) analysing data to determine migration patterns  
  • Use graphs for migration group enquiries requirement; analyse the data in the graphs and present analyse in peer groups


What opportunities will occur for transdisciplinary skills development and for the development of the attributes of the learner profile?

Thinker: determining suitability of graphs for different data

Thinking Skills: Analysing data in different ways

Communication Skills: Presenting data in various graph forms


PYP Planner Google Doc: Data Handling Maths PYP Planner


Saturday, 17 October 2015

Open-Ended & Enquiry-Based Data Handling Assessment


We began our assessment into data handling by looking again at our central idea and the questions we created that we felt we wanted to find out.  We discussed which we felt we had gained a good understanding of and those we hadn't and why. 


Each of us then shared something we felt we had improved at or felt proud of during our unit.  It was fascinating to hear all the different ideas shared and the positive sense of pride in our room.  With this positivity of our new understandings and learning, we were set to begin our open-ended activity.


The first part:


Being open-ended, students were able to take their learning as far as they could.  Some focused on one set of data provided whilst most analysed both sets of data.    

The instruction was simply to analyse as much as you can about the sets of data and to try to explain what that actually meant.


Some examples:


It's also interesting to assess how children arrange their thinking in these sort of activities as it can give an insight into their ways of thinking - big picture, logically-sequenced etc.


The Second Part:

The second part helped children to think about the suitability of graphs for different types of data.  Again, it was an open choice. 

Students chose to create pie graphs, line graphs or column graphs and explained why they felt they were a suitable graph choice.


They really enjoyed being given the freedom to choose the types of graphs they created as well as the set/s of data they wanted to convey in graph form. It also served as an important assessment to see if each child could determine a suitable graph or struggled with that. 


Early Finisher Challenges:

For early finishers, two open-ended questions related to data handling were given.  They were given the choice of which to try to solve:


Students who wanted to, were given the opportunity to share with us strategies they created to solve the questions. They were encouraged to share both successful strategies and importantly, to share strategies they had tried out but didn't help.  

By not sharing answers we had, the message hopefully being received was that the strategies and thinking of strategies is what we should be valuing as mathematicians and that correct answers are merely a positive outcome of that.   


Some truly amazing successful and unhelpful strategies were shared!


Giving children open-ended assessments rather than traditional maths tests provides them with a rich experience to do what mathematicians actually do and more importantly allows each child to feel successful in what they achieve as mathematicians.  


Wednesday, 14 October 2015

Differentiating For Line Graphs

Differentiating For Line Graphs

FUNCTION: How to create a line graph

We began by discussing our central idea and the questions we generated to explore:


We discussed briefly on what we had already discovered during our unit and what we still want to find out. 


We then watched this How to Create a Line Graph YouTube and discussed what it had taught us. 

We then discussed where we might see line graphs in our daily lives.

Our ideas:
- newspapers ( for articles and for weather forecasts)
- sometimes on news TV programmes
- documentaries
- websites

Why do we use graphs?
- It makes understanding information easier.
- We don't have to read long paragraphs; we can just read the graph.


We then looked at 4 examples of data and thought about which we could show using a line graph:


Andrea’s Bowling Scores


122,     156,      87,      112,     145


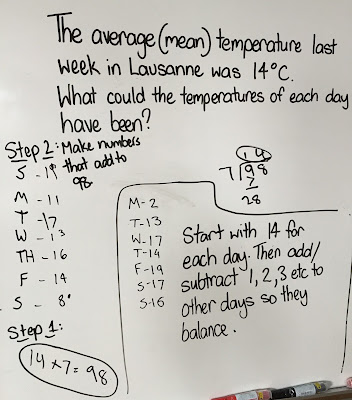
Average Temperature in Lausanne:
S-  15°C
M- 16°C
T-   14°C
W-  15°C
Th-  18°C
F-  17°C
S-  13°C


Number of Countries We Have lived in:


° 1 country:    IIII
° 2 countries:  III
° 3 countries II

° 4 or more countries: III


Number of Refugees in Past 20 Years:
Most of us agreed we could create a line graph to show 'Temperature in Lausanne' and the 'Refugees Infographic'.

Why?

- Eventually we came to the understanding that when we show a period of time, line graphs are a helpful graph choice.


Differentiating:

We looked at these 3 types of line graphs and chose 1 we felt would challenge us enough to create using the data provided (below) for Lausanne where we live:


Choice 1: Create a line graph that shows the average temperature:


Choice 2: Create a line graph that shows the average, maximum and minimum temperatures.   


Choice 3: Create a line graph that shows the average, minimum, maximum temperatures AND the average precipitation.


We then looked at data for Lausanne where we live and used it to create one of the types of line graphs we felt matched our level of understanding. 
 
Month
Mean Temp.
Max. Temp.
Min. Temp.
Mean Precipitation
Jan
1.6 °C
4.3 °C
  • 1.3 °C
9 mm
Feb
2.8 °C
6.3 °C
  • 0.7 °C
8 mm
Mar
6.0 °C
10.8 °C
1.3 °C
8 mm
Apr
9.1 °C
14.1 °C
4.2 °C
8 mm
May
13.7 °C
19.1 °C
8.5 °C
10 mm
Jun
16.9 °C
22.5 °C
11.6 °C
10 mm
Jul
19.7 °C
25.8 °C
13.9 °C
7 mm
Aug
19.2 °C
25.4 °C
13.7 °C
7 mm
Sept
15.3 °C
20.8 °C
10.5 °C
8 mm
Oct
10.5 °C
14.7 °C
6.8 °C
9 mm
Nov
5.4 °C
8.5 °C
2.3 °C
9 mm
Dec
2.8 °C
5.3 °C
0.1 °C
9 mm

Some children felt the simpler version of the line graph was best as they hadn't created a line graph before:


Others chose to create this slightly more challenging line graph:


Some chose to create the more challenging line graph:


By giving the children the choice and responsibility of selecting the level of graph they created, it helped cater to the various learning levels in our class.  It also helped foster within each child, a sense of ownership towards their own learning.  

We concluded by sharing our graphs in small groups and gave constructive feedback to each other on what we felt was done well and what could be a focus on in future graph making as part of a reflection.