FUNCTION: How to create a line graph
We began by discussing our central idea and the questions we generated to explore:

We discussed briefly on what we had already discovered during our unit and what we still want to find out.
We then watched this How to Create a Line Graph YouTube and discussed what it had taught us.
We then discussed where we might see line graphs in our daily lives.
Our ideas:
- newspapers ( for articles and for weather forecasts)
- sometimes on news TV programmes
- documentaries
- websites
Why do we use graphs?
- It makes understanding information easier.
- We don't have to read long paragraphs; we can just read the graph.
We then looked at 4 examples of data and thought about which we could show using a line graph:
Andrea’s Bowling Scores
122, 156, 87, 112, 145
Average Temperature in Lausanne:
S- 15°C
M- 16°C
T- 14°C
W- 15°C
Th- 18°C
F- 17°C
S- 13°C
Number of Countries We Have lived in:
° 1 country: IIII
° 2 countries: III
° 3 countries II
° 4 or more countries: III
Number of Refugees in Past 20 Years:
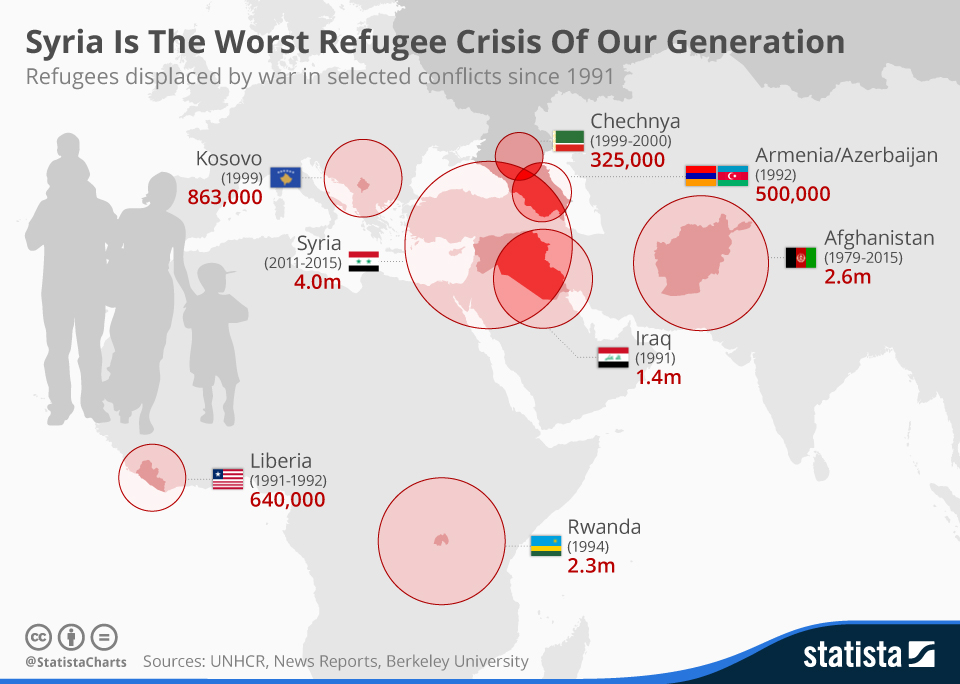
Most of us agreed we could create a line graph to show 'Temperature in Lausanne' and the 'Refugees Infographic'.
Why?
- Eventually we came to the understanding that when we show a period of time, line graphs are a helpful graph choice.
Differentiating:
We looked at these 3 types of line graphs and chose 1 we felt would challenge us enough to create using the data provided (below) for Lausanne where we live:
Choice 1: Create a line graph that shows the average temperature:

Choice 2: Create a line graph that shows the average, maximum and minimum temperatures.

Choice 3: Create a line graph that shows the average, minimum, maximum temperatures AND the average precipitation.

We then looked at data for Lausanne where we live and used it to create one of the types of line graphs we felt matched our level of understanding.
Month
|
Mean Temp.
|
Max. Temp.
|
Min. Temp.
|
Mean Precipitation
|
Jan
|
1.6 °C
|
4.3 °C
|
|
9 mm
|
Feb
|
2.8 °C
|
6.3 °C
|
|
8 mm
|
Mar
|
6.0 °C
|
10.8 °C
|
1.3 °C
|
8 mm
|
Apr
|
9.1 °C
|
14.1 °C
|
4.2 °C
|
8 mm
|
May
|
13.7 °C
|
19.1 °C
|
8.5 °C
|
10 mm
|
Jun
|
16.9 °C
|
22.5 °C
|
11.6 °C
|
10 mm
|
Jul
|
19.7 °C
|
25.8 °C
|
13.9 °C
|
7 mm
|
Aug
|
19.2 °C
|
25.4 °C
|
13.7 °C
|
7 mm
|
Sept
|
15.3 °C
|
20.8 °C
|
10.5 °C
|
8 mm
|
Oct
|
10.5 °C
|
14.7 °C
|
6.8 °C
|
9 mm
|
Nov
|
5.4 °C
|
8.5 °C
|
2.3 °C
|
9 mm
|
Dec
|
2.8 °C
|
5.3 °C
|
0.1 °C
|
9 mm
|
Some children felt the simpler version of the line graph was best as they hadn't created a line graph before:

Others chose to create this slightly more challenging line graph:

Some chose to create the more challenging line graph:

By giving the children the choice and responsibility of selecting the level of graph they created, it helped cater to the various learning levels in our class. It also helped foster within each child, a sense of ownership towards their own learning.
We concluded by sharing our graphs in small groups and gave constructive feedback to each other on what we felt was done well and what could be a focus on in future graph making as part of a reflection.
No comments:
Post a Comment
What do you think? ...........